
Security Insights
Analytics Dashboard

Security Insights
Analytics Dashboard
Overview
Security Operations Dashboard evaluates how efficient and effective the security team operates to protect the organization. It gives valuable insights to security managers including alert summary and response performance.
Security Operations Dashboard evaluates how efficient and effective the security team operates to protect the organization. It gives valuable insights to security managers including alert summary and response performance.
The redesign of security operations dashboard improves the usability and visual design, which is widely adopted by our customers.
Role:
Design Lead
Design Lead
Timeline:
2024.02-2024.04
2024.02-2024.04
Contribution:
User Research
User Research
UI/UX Design
UI/UX Design
Data Visualization
Data Visualization
Team:
1 Product Manager
1 Product Manager
2 Software Engineer
2 Software Engineer
1 Product Designer
1 Product Designer
3 Customer Success
3 Customer Success
Background
Background
The Ambient platform generates valuable insights and data that was previously not available before through its deep learning models. The Ambient Analytics feature provides visibility to this data and allows customers flexibility to dissect the data in a manner of their choosing.
The Ambient platform generates valuable insights and data that was previously not available before through its deep learning models. The Ambient Analytics feature provides visibility to this data and allows customers flexibility to dissect the data in a manner of their choosing.
Security Operation Metrics
Security Operation Metrics
In the process of security operation, operators will dispatch responder for real incident and resolve false positive alerts. When it comes to evaluate how efficient and effective the security team react to alerts, alert breakdown and response performance are the 2 key metrics for security operation insight.
In the process of security operation, operators will dispatch responder for real incident and resolve false positive alerts. When it comes to evaluate how efficient and effective the security team react to alerts, alert breakdown and response performance are the 2 key metrics for security operation insight.

The "Before"
The "Before"
The old security operations dashboard shows all the metrics that we defined previously. However, the individual charts can’t provide much security insights for customer’s security leadership team. The dashboard visualization can be improved for better usability.
The old security operations dashboard shows all the metrics that we defined previously. However, the individual charts can’t provide much security insights for customer’s security leadership team. The dashboard visualization can be improved for better usability.

Solutions
Solutions
💭 Are my sites well-protected?
💡 Alerts Breakdown with Historical Data
Alert count for each status is first class citizen for enterprise security team. Having the ability to view historical data for a given period of time (last day/week/month) has significant impact on stakeholders decision making. The new design also allows user to understand how well their sites are protected by breaking down the historical data by sites.
Alert count for each status is first class citizen for enterprise security team. Having the ability to view historical data for a given period of time (last day/week/month) has significant impact on stakeholders decision making. The new design also allows user to understand how well their sites are protected by breaking down the historical data by sites.
💭 How quickly are we taking actions on security alerts?
💡Time to Response
When incident happens, every second matters. Stakeholders value the [time to take actions] as their key metrics to measure whether the security operation is efficient and effective. The design further breaks it down to include [time to act], [time to resolve], [time to respond to dispatch] with historical data.
When incident happens, every second matters. Stakeholders value the [time to take actions] as their key metrics to measure whether the security operation is efficient and effective. The design further breaks it down to include [time to act], [time to resolve], [time to respond to dispatch] with historical data.
💭 How is my security team operating?
💡 Individual Performance
The operator performance table and responders performance table both show how well they function as part of the security team. Customers can choose to group them by site and view historical data for each individual for evaluating their performance.
The operator performance table and responders performance table both show how well they function as part of the security team. Customers can choose to group them by site and view historical data for each individual for evaluating their performance.
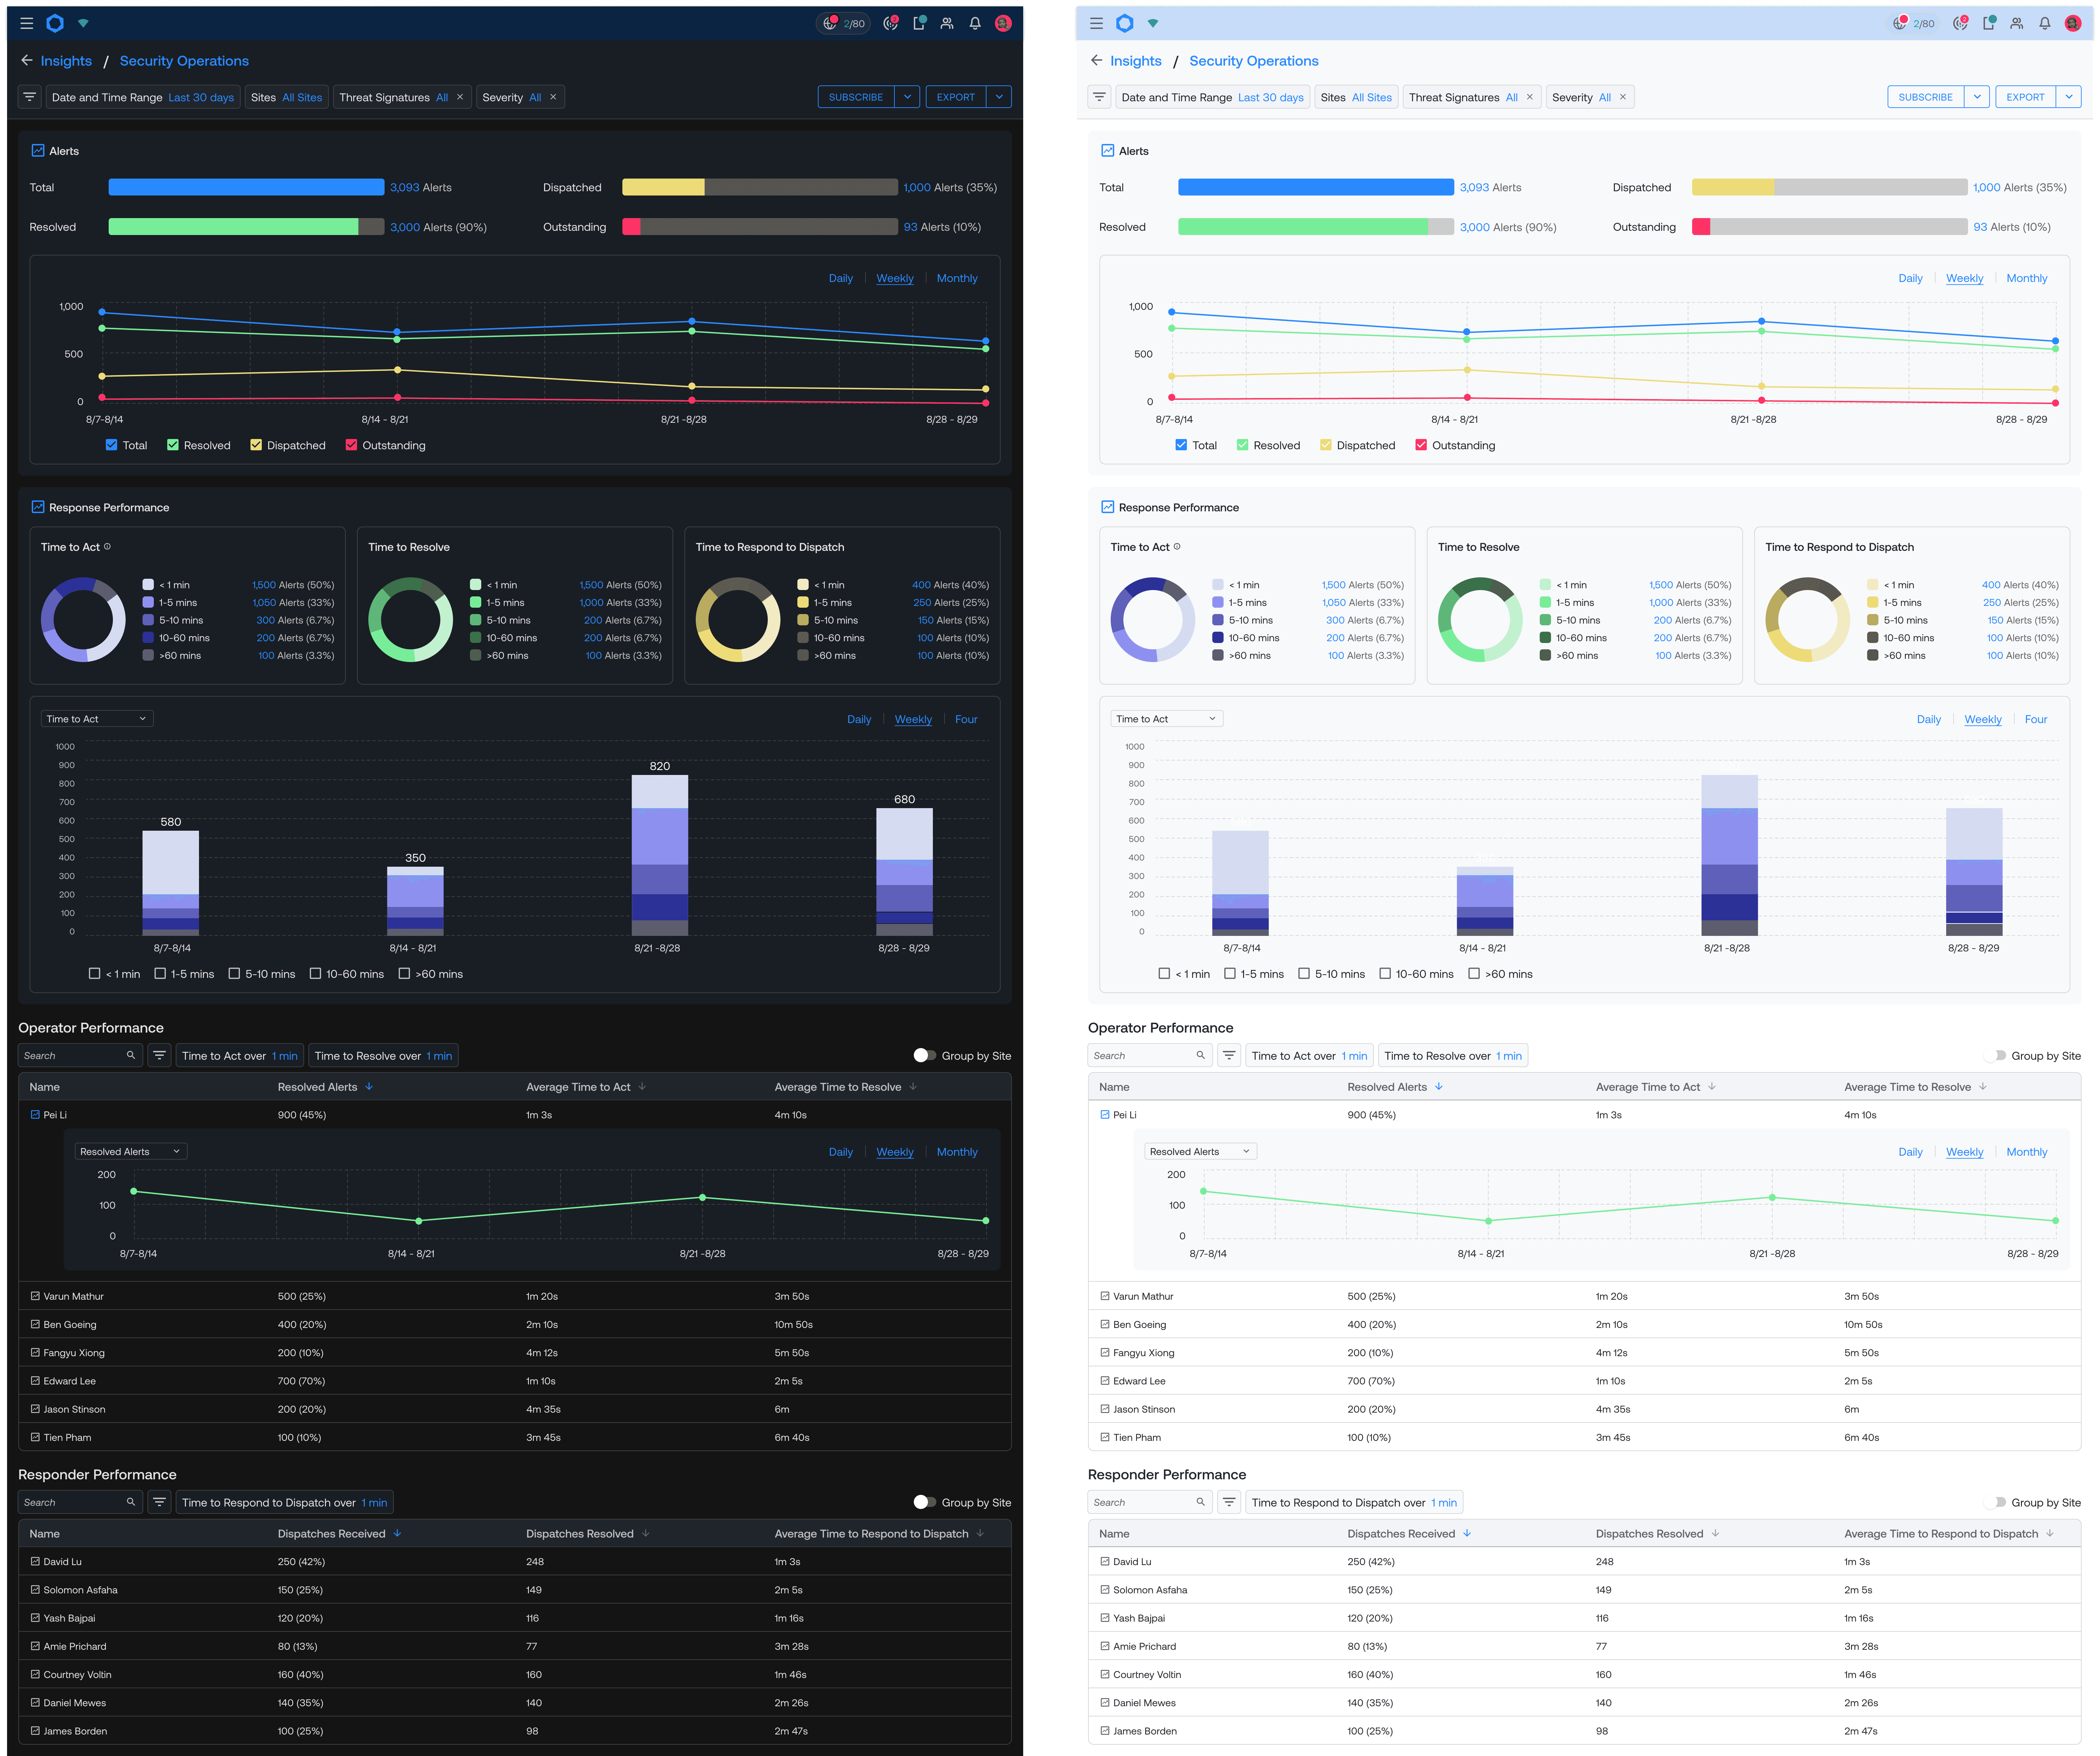
🎭 Dark Mode vs. 🎨 Light Mode
Customer Success
Customer Success
The new security operations dashboard was demoed to our customers by customer success team, which received massive positive impact.
We've continuously worked on some quality of life improvements for the dashboard after release. Right now customers are actively using the dashboard to get security insights and evaluate security team operation performance.
